Fungi worldwide

Statistics

Numbers on the world of fungi — always with a unit, a period and a method. How many species there are, and how far mycelium actually reaches.

entries
22
illustrated
22
with sources
22

22 metrics · 14 dated measurements · 8 estimates

The context that matters most

We have described only about 4–7% of fungal species

The registers hold over 150 thousand described species, while the modelled range is 2.2–3.8 million. That compares two different kinds of data: a catalogue of names and an estimate of diversity.

described

about 155,000

estimated

2–3 million · best estimate 2.5 million

known: 5.27.8%undescribed: over 93%

Statistics

Diversity and described species

How many species are known, what models predict and how quickly the catalogue grows. Names, species hypotheses and total-diversity estimates are different measures.

239,180 at the 1% threshold

species hypotheses

239,180 fungal species hypotheses in UNITE

UNITE clusters ITS sequences into species hypotheses. Version 10.0 holds 239,180 of them — far more than the number of described fungal species.

UNITE 10.0 snapshot: fungal SHs at the 1% threshold and 3,846,536 ITS sequences. A different threshold yields a different count.

Sequences are not species

ITS sequences3,846,536
species hypotheses at 1%239,180
2026 high confidence
How this number was calculated

2–3 million · best estimate 2.5 million

species

The estimated number of fungal species worldwide

Kew estimates global fungal diversity at 2–3 million species, with 2.5 million as its best working estimate. About 155,000 have been formally named—roughly 6.2% of that central value.

A synthesis of four method families: scaling laws, fungus-to-plant ratios, discovery accumulation and DNA evidence. The numeric 2.5 million is the best working point within the 2–3 million range.

A range, not a single count

2.0m2.5m3.0m
2023 medium confidenceestimate
How this number was calculated

about 155,000

formally named species

The number of described fungal species

Kew’s 2023 report gives about 155,000 formally named fungal species. That is only 6.2% of the 2.5-million best estimate for total diversity.

A dated benchmark from Kew’s 2023 report. It is not a sum of every name record or a real-time counter.

Known names against expected diversity

described155k
not yet described — modelabout 2.345m
2023 high confidence
How this number was calculated

mean about 3,900/year · 7,800 in 2024–2025

new species per year

How many new fungal species are described each year

More than 7,800 new fungal species were named across 2024–2025. That averages about 3,900 a year, but the source does not publish separate totals for each of the two years.

Arithmetic mean of Kew’s reported two-year total of more than 7,800 new names. The source does not split the total between 2024 and 2025.

The pace of description has risen

Kew 2023 baselineabout 2,500/year
2024–2025 meanabout 3,900/year
2024–2025 high confidenceestimate
How this number was calculated

Statistics

The scale below ground and climate

Modelled values for hyphal reach, mycorrhiza and carbon flow. The range and the method assumptions matter especially here.

13.12

Gt CO₂e/year · flux

13.12 Gt CO₂e a year goes to mycorrhizal mycelium

A global synthesis estimated the flow of carbon from plants to three main mycorrhizal types; it is a flux, not a permanent climate store.

Sum of modelled flows for arbuscular (3.93), ectomycorrhizal (9.07) and ericoid mycorrhiza (0.12 Gt CO₂e/year). It is not permanent storage.

What makes up the 13.12 Gt

ectomycorrhiza9.07 Gt
arbuscular3.93 Gt
ericoid0.12 Gt
2023 medium confidenceestimate
How this number was calculated

1.10 × 10¹⁷ ± 0.13 × 10¹⁷

km of living hyphae

110 quadrillion km of AMF hyphae in topsoil

The first global model of AMF network density gives a length with an uncertainty range, and only for the top 15 centimetres of soil.

A machine-learning model from 322 studies and more than 16,000 cores; AMF in the top 15 cm of soil. Uncertainty is ±1 SD.

The model with its uncertainty

0.97 × 10¹⁷ km1.10 × 10¹⁷ km1.23 × 10¹⁷ km
2026 medium confidenceestimate
How this number was calculated

72%

of species · arbuscular mycorrhiza

72% AM · 10% orchid · 2% EcM · 1.5% ericoid

The share of land plants forming mycorrhiza

A global synthesis assigned 72% of vascular plant species to arbuscular, 10% to orchid, 2% to ectomycorrhizal and 1.5% to ericoid mycorrhiza.

A synthesis of 135 years of root-colonisation data combined with plant phylogeny. The primary value is the commonest type; other types are shown separately.

The “90%” combines different relationships

arbuscular72%
orchid10%
ectomycorrhiza2%
ericoid1.5%
2018 high confidenceestimate
How this number was calculated

Statistics

Open data and documentation

An occurrence record is neither an individual nor a species. These snapshots mainly show the scale and form of documentation.

57.03%

of Polish records

57.03% specimens · 21.92% observations

Poland's picture of fungi still rests on herbaria

In the global snapshot, 45.92% of records are human observations and 23.28% preserved specimens. In Poland the shares are 21.92% and 57.03%, respectively.

Two GBIF basisOfRecord faceted queries for the world and Poland. Shares use the total record count in each scope.

The same resource, a different documentation mix

human observation45.92%
21.92%
preserved specimen23.28%
57.03%
2026 high confidence
How this number was calculated

450,470

occurrence records

450,470 Polish fungal records in GBIF

An API snapshot on 29 August 2026 returned 450,470 fungal records from Poland—3,062 (0.68%) more than on 15 August and 0.742% of the global resource.

GBIF occurrence/search snapshot: taxon_key=5, country=PL, limit=0. Global share was calculated against the simultaneous query without a country filter.

The snapshot grows as data are published

15 August 2026447,408
29 August 2026450,470
2026 high confidence
How this number was calculated

60,750,818

records

GBIF makes 60.75 million fungal records available

An API snapshot on 29 August 2026 returned 60,750,818 Fungi records. Poland’s subset is 450,470, or about 0.742% of the global resource.

GBIF occurrence/search snapshot with taxon_key=5 and limit=0. Basis-of-record categories were fetched with facet=basisOfRecord.

Global scale and the Polish subset

world60,750,818
Poland450,470 · 0.742%
2026 high confidence
How this number was calculated

Statistics

Conservation, health and safety

Formal assessments, priority lists and case registers — each number has a different denominator and level of completeness.

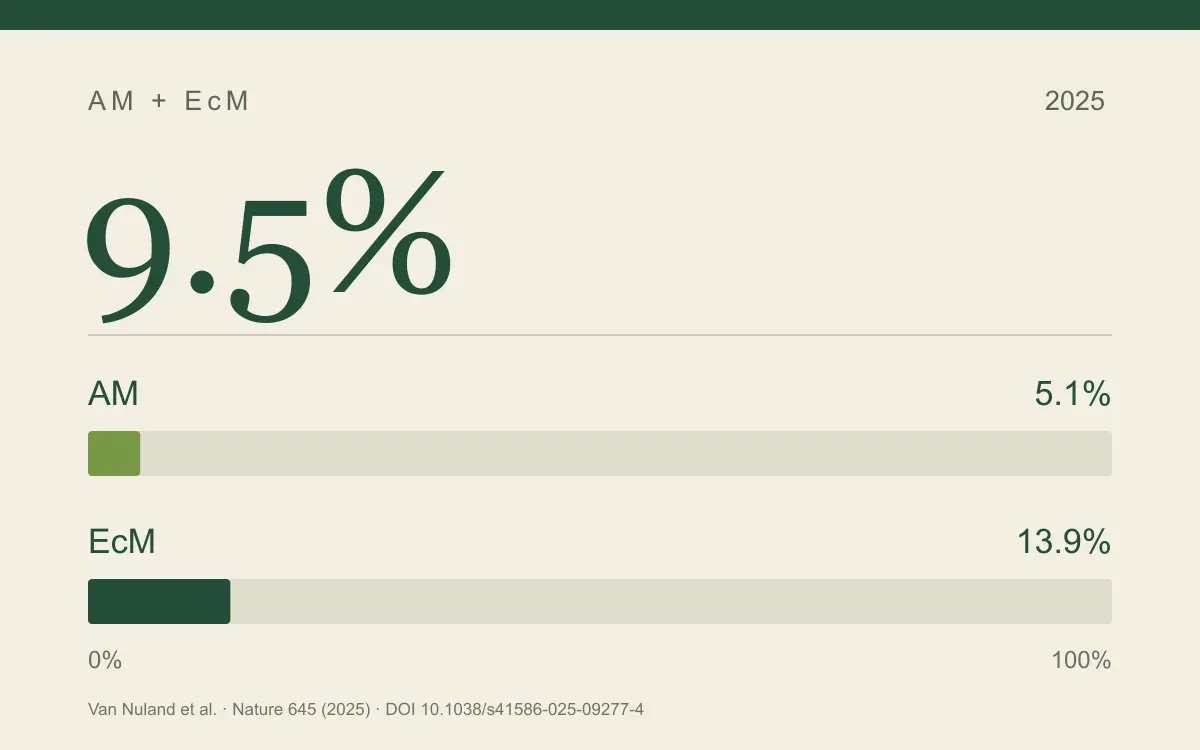
9.5%

of richness hotspot area

9.5% overall · 5.1% AM · 13.9% EcM

9.5% of mycorrhizal richness hotspots fall within protected areas

A 2025 global analysis compared predicted fungal richness with protected-area boundaries. Its result concerns mapped land area, rather than the percentage of fungal species receiving protection.

Published in 2025: overlap of modelled AM and EcM richness hotspots above the 95th percentile with World Database of Protected Areas boundaries. The year identifies the analysis publication, not collection of every sample. It measures neither protection effectiveness nor the fraction of threatened species.

2025 medium confidenceestimate
How this number was calculated

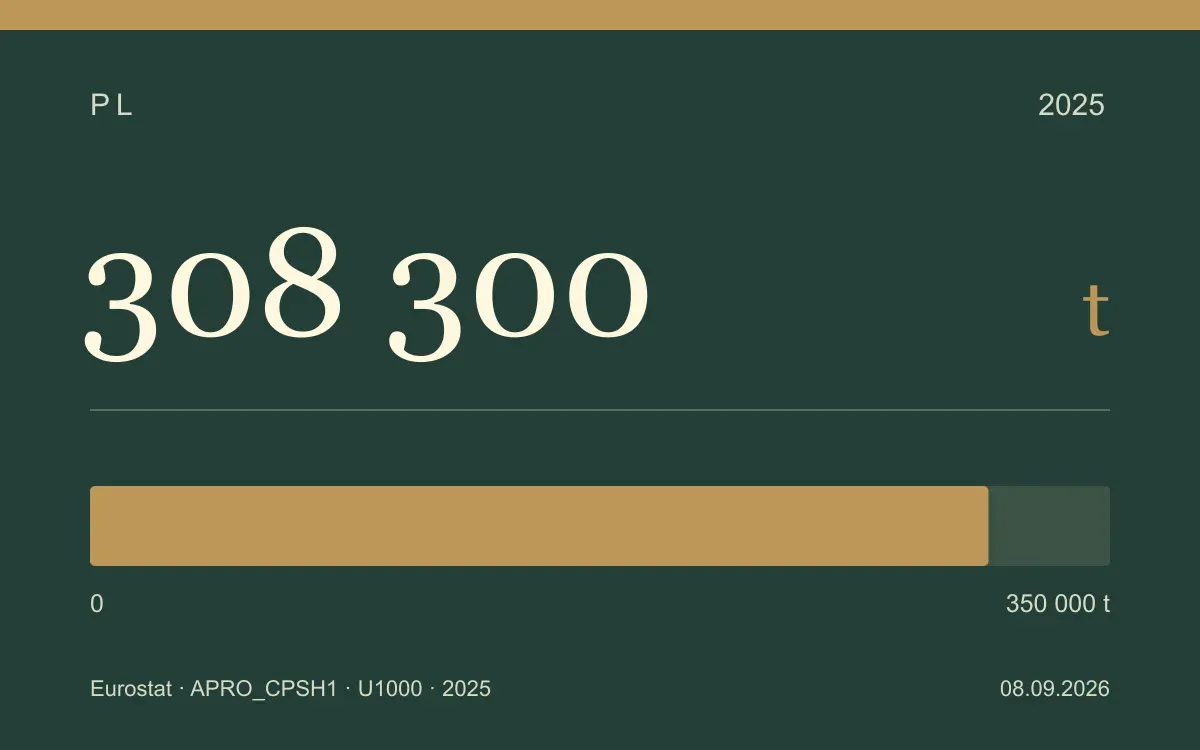
308.3 thousand tonnes

tonnes of cultivated mushrooms

Poland produced 308.3 thousand tonnes of cultivated mushrooms in 2025

Eurostat reports 308.3 thousand tonnes of cultivated mushroom production in Poland for 2025. The figure measures production activity, separately from wild harvests and natural-history observations.

Eurostat APRO_CPSH1 retrieval on 8 September 2026: geo=PL, time=2025, crops=U1000 (Cultivated mushrooms), strucpro=HPRD_HUMD_EU_THS_T. The reported 308.3 thousand tonnes was converted to 308,300 tonnes. This official aggregate is revisable and does not imply measurement precision to a single tonne.

2025 high confidence
How this number was calculated

16 · 0.04/100,000

notified poisonings

16 mushroom poisonings notified in Poland in 2025

The provisional 2025 bulletin reports 16 notifications and an incidence of 0.04/100,000; the 2024 comparators are 13 and 0.03. The table still warns that registration is incomplete.

Provisional 2025 notification bulletin, “mushroom poisonings” row, with 2024 comparison. The source labels registration as incomplete.

Notifications, not the full number of poisonings

2024 · 0.03/100k13
2025 · provisional · 0.04/100k16
2025 medium confidence
How this number was calculated

4 critical · 7 high · 8 medium

pathogens or groups

19 fungal pathogens and groups on the WHO priority list

WHO’s 2022 list covers 19 pathogens or taxonomic groups: 4 critical, 7 high-priority and 8 medium-priority entries. Not every entry is a single species.

WHO multicriteria decision analysis. List units are pathogens or taxonomic groups, not always single species.

WHO’s three priority groups

critical4
high7
medium8
2022 high confidence
How this number was calculated

3.8m associated · 2.5m attributable

deaths a year

3.8 million deaths a year associated with severe fungal disease

A model for 2019–2021 estimates 3.8 million deaths a year associated with severe fungal disease, about 2.5 million of them directly attributable.

Population-at-risk model: 6.5m invasive infections, 3.8m associated deaths and 2.5m directly attributable deaths. Data cover more than 120 countries.

Three levels of burden

invasive infections/year6.5m
associated deaths3.8m
2019–2021 medium confidenceestimate
How this number was calculated

0.6%

of known species

0.6

Only 0.6% of known fungi have an IUCN assessment

The 2026 Kew report shows the scale of the gap: the Red List describes the threat to only a tiny fraction of known fungal species.

Share of species with a formal IUCN assessment in Kew’s 2026 report. The denominator is species known to science, not modelled total diversity.

Six assessments per thousand known species

assessed0.6%
without a formal assessment99.4%
2026 medium confidenceestimate
How this number was calculated

1,300 assessed · ≥411 threatened

species

Fungi assessed on the IUCN Red List

By 27 March 2025 the IUCN had assessed 1,300 fungal species; at least 411 were judged threatened. That is still under 1% of described species.

A formal IUCN Red List snapshot dated 27 March 2025. The 411 figure is a subset of the 1,300 assessments, not a sample of all fungi.

Assessment and threat are two counters

formally assessed1,300
in threatened categories≥411 · ≥31.6% of assessed
2025 high confidence
How this number was calculated

Statistics

MykoRadar data

These are dated snapshots of our database, not live counters — which is what makes each value comparable with the next measurement.

24.09%

of recorded species

336 of 1,395 species

One in four recorded species was seen just once

Of 1,395 species with observations, 336 have exactly one record (24.09%). The top 10 hold 18.08%, and the top 50 hold 45.30%, of 44,007 species-linked observations.

Species with occurrence_count = 1 divided by species with occurrence_count > 0. Top-10/25/50 concentration uses 44,007 species-linked observations.

The long tail and concentration of records

species with one record336 of 1,395 · 24.09%
top 10 share7,958 · 18.08%
2026 high confidence
How this number was calculated

22.41%

of the catalogue

426 of 1,901 species

We know edibility for 22% of atlas species

Edibility status is recorded for 426 of 1,901 catalogue species (22.41%): 161 edible, 133 inedible, 118 toxic and 14 deadly. The other 1,475 remain “unknown”.

Exact count of edibility categories in the species table. Determined means edible, inedible, toxic or deadly; unknown remains no assessment.

Catalogue classification under audit

values hidden pending auditnot published
2026 high confidence
How this number was calculated

48,669

observations

Fungal observations gathered in MykoRadar

The database snapshot of 29 August 2026 contains 48,669 observations. That is 2,580 records (5.60%) more than on 29 July; it is not a count of individuals or an even survey of Poland.

An exact count of rows in MykoRadar’s production observations table. The snapshot includes every source held by the database at measurement time.

Growth between two snapshots

29 July 202646,089
29 August 202648,669
2026 high confidence
How this number was calculated

73.38%

of catalogue species

1,395 of 1,901

How many atlas species have a real observation

At least one observation is linked to 1,395 of the catalogue’s 1,901 species, or 73.38%. The remaining 506 entries do not yet have a MykoRadar occurrence record.

Species with occurrence_count > 0 divided by every row in the species table: 1,395 / 1,901 × 100.

Catalogue coverage by observations

with ≥1 observation1,395 · 73.38%
without an observation506 · 26.62%
2026 high confidence
How this number was calculated

1,901

catalogue species

Fungal species in the MykoRadar atlas

MykoRadar’s catalogue contained 1,901 species on 29 August 2026. This is a versioned snapshot of a working catalogue; the lower count alone cannot identify the editorial changes behind it.

An exact count of rows in the species table. Change from the earlier snapshot is reported without assigning a cause until the change log is compared.

The catalogue is a versioned snapshot

29 July 20262,050
29 August 20261,901
2026 high confidence
How this number was calculated